SonicWall Stack traces, tasks, and Services Explained
Just wanted to share out this information from some old notes that I had collected during my time supporting SonicWall Firewalls. Some of this information may be out of date and it is all based on the firmware before SonicOS 7 came out.
The intention of this article is to educate and assist in the understanding of Stacktraces and trace logs. Some of the explanations may seem pretty straightforward and obvious based on the Traces, just were never realized previously.
If you ever open a ticket with SonicWall for a stack trace just kindly ask the Support tech if they could ask the developers for a little bit more information on the crash of that trace. Most of the Techs should have access to the internal Stack Trace Decryption tool so they may already know a little bit more about the issue that is happening and can relay that information to you without disclosing the actual decryption.
The information in this article has no hard evidence and is all based on experience and knowledge obtained over time.
UPDATE 8.6.2019:
As of 6.5.3-ish firmware, some of the task-IDs and traces have either been obfuscated or the newer tasks are no longer being given names and just ID numbers. It is starting to become more common to just see trace logs that say process task-id 83763 than actually seeing a named task in the trace. We do not have any information on what these are or what they are related to, as they could just be some multi-spawn of another task that we are just not aware of yet. If SonicWall gives you any information on these, please see about updating this Knowledge article to share with everyone.
General Knowledge:
Stack trace is a report of the active stack frames at a certain point in time during the execution of a program. Source These Stack Traces are used by development to help in pointing in a direction of where an issue may lie within the programming but not always exactly the issue is.
Each Stack trace will related to either DP (Data Plane) or CP (Control Plane) and a majority of the time it will tell you the task it was related to. There can be times where there are no tasks listed but is just a general crash.
These crashes can either be fixed with correcting some sort of configuration issue on the device or they require a hotfix to correct an actual unexpected programming issue.
Did you know ? SonicWall Routing is handled by a common Open Source Platform called ZebOS and if you would like to understand more about how routing, OSPF, RIP, and BGP work within SonicWall you can go out and get Quagga which is a fork of the discontinued version of ZebOS. This is denoted in the tasks/services with a z in the front, example zOSPF6d (As an addition to the Quagga item, you might want to look into https://frrouting.org/ if you would like to gain a better understanding)
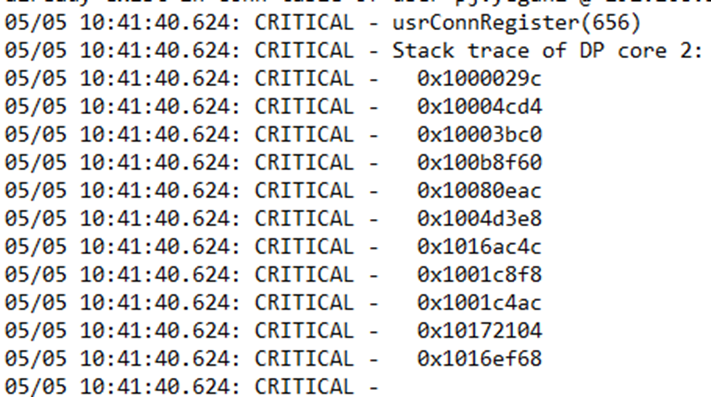
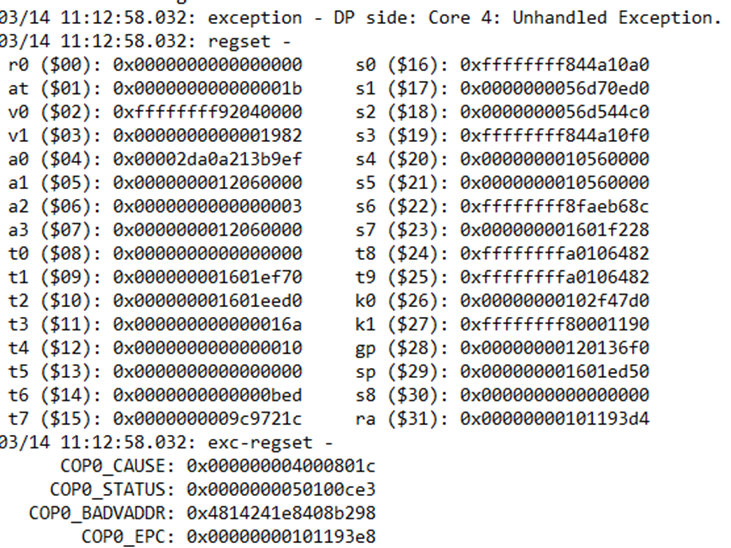
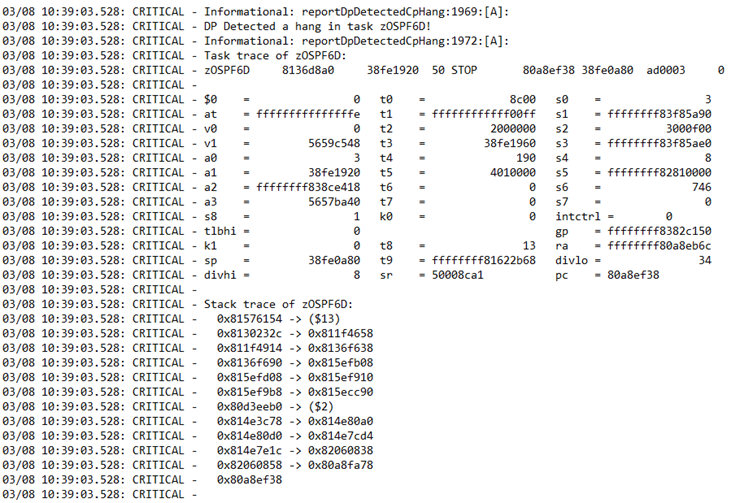
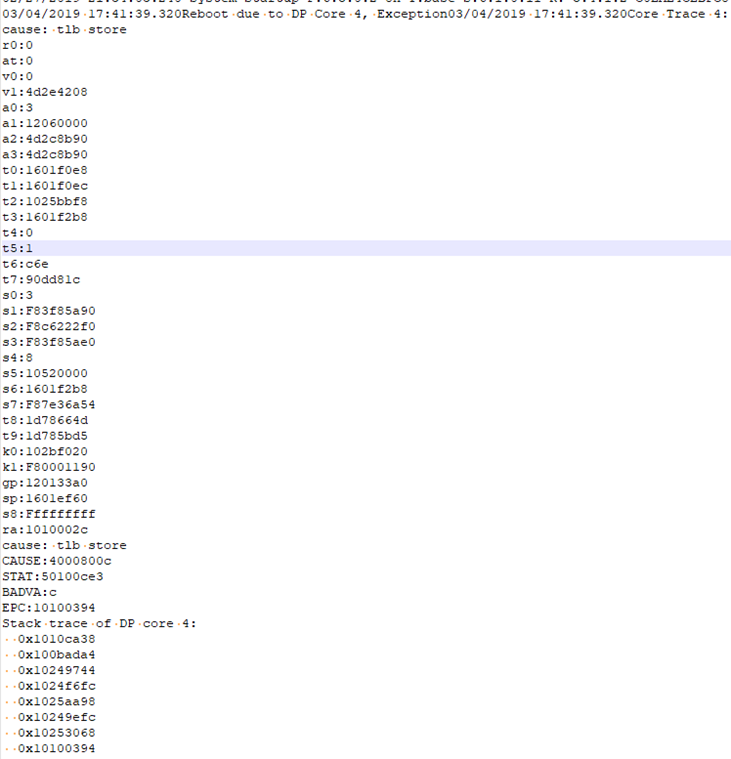
3 Examples of Stack Traces seen in the Trace logs


The example on the left is generally the type that will tell you a little more about what task might have triggered the Stack trace where as the one on the right is more of a “this was what got reported on the core”.
In the Tech Support Report you will see the Stack Trace like this:

These are just some common examples and they can vary from firmware to firmware and depending on the crash they can look a little different.
Can we decode these Stacktraces?
No, we would need to know what all that hex was referencing so only SonicWall Development can.
Now let us get into what you came here for; what can I learn from these Stack Traces and how can they help me ?
Format: On the Right will go the Stack Trace and on the left will be the explanation of possibly what it is and possible Work Arounds that can be implemented
- tSnmpd
- tAsFlhWr
- tsfTaskDB
- tWebMain
- tLdapAsyncTask
- tAsyncNameLkp
- tCIAProbeTask
- tCloudBkup
- ipnetd
- zRIP
- tSslvpnListen
- tSshN-#
- zOSPF6D
- Dataplane
- PassToStack
- tWebMain
tSnmpd
relates to SNMP configuration
Things to check:
- SNMP enabled on WAN, make sure WAN Access Rule is locked down
- Make sure using SNMPv3
- Check Community String to make sure it is BP or Complex
Reasons for crash on service:
- Over-utilization of Service, aka getting spammed with SNMP requests
- Or malfunction of Service, which can be verified by checking the above
If you see a log like: CRITICAL – spinlock MemZoneSpinock @ 0x844a10f0 is held for more than 2 secs. Currently held by CP:0x8fe2c0c0 (tSnmpd), this could be pointing to a misconfiguration or SNMP being spammed with requests. MemZoneSpinock (suppose to be MemZoneSpinlock) is related to the Control Plane memory allocation to the service being over-utilized.
Stack trace of tSnmpd:
0x816a4784 -> ($13)
0x80fda304 -> 0x80fd8be0
0x80fd8f14 -> 0x80fda4a8
0x80fce458 -> 0x80fce228
0x80fce1a8 -> 0x80fc8cf0
0x80fc8e20 -> 0x80fc6118
0x80fc6164 -> 0x80fd8058
0x80b4f3b0
tAsFlhWr
means Write to Flash, which to my knowledge is the SonicWall trying to write to the non-volatile cache or trying to write a configuration to the Flash and having an issue. This one seems to generally end up resulting in a hotfix being required and is just being reported on because of another task/service having an issue
You can sometimes see a line before the stack trace for: task-id mismatch
Example: task-id mismatch: task 0x8c8a64c0 (tAsFlhWr) accessing globals for task 0x62c44200 (tSshC-0)
In this example you would want to refer to the t SshC-0 (not created yet so i will put it here) This is for SSH Control, so make sure that on the WAN side that there is the SSH Management Lockdown rule in place.
Some of the times you will end up with a ((null!)) at the end of that message which means there was a service running that no longer is there. If you did not know SSH actually generates a new “session” with every connection except for the SSH daemon which is tSshd and the tSshC-0, tSshN-0 just change the number on the end.
Things to check:
- Just do a quick BP check of the Objects to make sure there isn’t anything with any crazy symbols
Stack trace of tAsFlhWr:
0x81576154 -> ($13)
0x804da8c4 -> 0x804d8930
0x804d89a8 -> 0x8049d658
0x8049d6a8 -> 0x8049ce40
0x8049d190 -> ($2)
0x807bcd98 -> 0x80e7ca48
0x80e7ca58 -> 0x80e7c918
0x80e7c928 -> 0x80e76258
0x80e76268 -> 0x80e75e70
0x80e76000
tsfTaskDB
relates to a lot of different things, generally when this is seen by SonicWall Support one of the first things you may be asked to do is Disable AppFlow to Local Collector.
Partially this is for the developers to see if there is something else that is crashing the service, but also the AppFlow Feature can multiple an issue and cause the crashes so SonicWall looks for that type of resolution. This is where if turning off that feature resolves the issue, you need to push for root cause resolution, as “we would like to have AppFlow ON” even if we do not.
Things to check:
- SonicWall Core 0 things (https://www.sonicwall.com/support/knowledge-base/170503645180339/)
Need to find a stack trace
tWebMain
relates to the WebGUI of the SonicWall interface. This service comes with multiple numbers and relates with tWebListen(er).
One of the major reasons for this to crash is aggressive Web Vulnerability Scanning. The example below shows an aggressive POST-URI scanner:
However: this can also relate to other things such as LDAP Auto Sync, or SSO Synchronization. So, be on the lookout for other Stack Traces that may point to other issues..
Things to check:
- No Geo-IP on Management Rules or no Management Rule Lockdown
- Pull GMS logs to identify potential aggressor IPs to blacklist
- Find out if that unit just under went some Compliance scan
Informational: webSrvrThreadTimer:7049:
Web server thread tWebMain02 has been busy for 40 seconds in state HttpsHandshake; fd 58 10.10.66.143:57768 -> port 446, NONE of ”
Stack trace of tWebMain02:
0x81576154 -> ($13)
0x80e7a41c -> 0x80e6ab58
0x80e6ac1c -> 0x809e5c40
0x809e5d38 -> 0x816217a8
0x81622bec
Socket fd 58 @ 0x4fa41e38: loc 10.10.66.254:446 rem 10.10.66.143:57768 prot 6 (TCP)
Ipnet_socket @ 0x4fa2cd90
creator: tWebListen
flags: non-blocking, bound, connected, peer-wr-closed, data-avail
TCP info (Iptcp_tcb @ 0x4fa2ce50):
state: 5 (CLOSE_WAIT)
flags none
tLdapAsyncTask
relates to potentially to pulling Users from a Domain or SSO, not 100% on this one. Definitly relates to User Identification in someway
Things to check:
- SSO is having any issues
- LDAP OUs are only what is required
- LDAP User account is valid and password is correct
- Is User or Group Mirroring turned on ?
Stack trace of tLdapAsyncTask:
0x816291fc -> ($13)
0x803ef750 -> 0x803ea898
0x803ea9bc -> ($2)
0x81099010 -> 0x810986c0
0x810989a0 -> ($2)
0x80e6fb68 -> 0x80a694d0
0x816a1628 -> 0x80dd5840
0x80dd505c -> 0x80bd7700
0x80bd7798 -> 0x80f164b8
0x80f16768
tAsyncNameLkp
relates to Name Resolution configuration
Things to check:
- Name Resolution Setting make sure this is BP, if the SNWL is configured for DNS make sure it is an internal DNS server.
- If the setting is set to NetBIOS and they have a decent amount of machines on the network then that would have to be turned off and a DNS server would be advised.
Stack trace of tAsyncNameLkp:
0x816291fc -> ($13)
0x80b09af8 -> 0x80b093d0
0x80b09504 -> 0x8038dd48
0x8038dea4 -> 0x816a15d0
0x816a1628 -> 0x80dd5840
0x80dd505c -> 0x80bd7700
0x80bd7798 -> 0x80f164b8
0x80f16768
tCIAProbeTask
relates to Authentication
Things to check:
- If SSH is open and getting brute forced on SSH
- SNMP is open with Authentication Turned On
- SSO is having issues identifying IP addresses
- Wrong Passwords used in any features like SSO or LDAP
Stack trace of tCIAProbeTask:
0x816291fc -> ($13)
0x8044f2e8 -> 0x8044ed78
0x8044ee24 -> 0x80a694d0
0x816a1628 -> 0x80dd5840
0x80dd505c -> 0x80bd7700
0x80bd7798 -> 0x80f164b8
0x80f16768
tCloudBkup
relates to the Cloud backup feature (obviously XD)
Things to check:
- Only thing here to look at is the Cloud backup setting and making sure that it can resolve the SonicWall Domains.
Stack trace of tCloudBkup:
0x816291fc -> ($13)
0x804a9914 -> 0x804a9130
0x804af990 -> 0x81016fc8
0x81017688 -> 0x80a694d0
0x816a1628 -> 0x80dd5840
0x80dd505c -> 0x80bd7700
0x80bd7798 -> 0x80f164b8
0x80f16768
ipnetd
relates to general routing do not know specifically what this is related to but overall is known for IP route handling. Potentially this could be a pass to stack service that takes the IP traffic data and decides what other service is suppose to be handling the routing.
Things to check:
- Routes
- Dynamic routing
- Tunnel VPNs
Stack trace of ipnetd:
0x816291fc -> ($13)
0x8159e9d0 -> 0x8159e790
0x8159e898 -> 0x8159e6c0
0x8159e738 -> ($16)
0x8159db20 -> 0x8159d840
0x8159da00 -> 0x815cf3fc
0x815cf678 -> 0x815ce4f0
0x815ce7ec -> 0x8158394c
0x805a5c78 -> 0x809e1570
0x809e15e4 -> 0x809dc680
0x809dc6c8 -> 0x809dc2a8
0x809dc428 -> 0x80b51a38
0x80b521c8 -> 0x80b73d18
0x80b73efc -> 0x80b31790
0x80b31d6c -> 0x80b2c140
0x80b2c1f8 -> 0x80b2c140
0x80b2c1c0 -> ($17)
0x80de65bc -> 0x80dfbe00
0x80dfbf30 -> 0x80a58328
0x80a579d8
zRIP
relates to, you guessed it, RIP routing Protocol. This is another one though that you end up randomly seeing even when not in use.
Things to check:
- Routes
- Dynamic routing
- Tunnel VPNs
Stack trace of zRIP:
0x816291fc -> ($13)
0x8142bbfc -> 0x8140da88
0x8140db1c -> 0x8140da48
0x8140da64 -> 0x81271170
0x81271184 -> 0x81270be0
0x812710f0 -> 0x8126e9d0
0x8126eacc -> 0x8126e488
0x8126e87c -> 0x8126e488
0x8126e5ec -> 0x8126e370
0x8126e394 -> 0x81424238
0x81424260 -> 0x8142ab50
0x8142ab64 -> 0x814194c8
0x814194f8 -> 0x80b14060
0x80b13088 -> 0x816d5f50
0x816d7394
tSslvpnListen
relates to SSL-VPN and the Virtual Office Page. This is another one of those that can get hit hard with Aggressive Web Vulnerability scanners.
Things to check:
- Pull Report from GMS to look for Abusive IPs
- Check to see if Botnet and Geo-IP is turned on, if not look into at least creating a rule for the SSL-VPN port
Stack trace of tSslvpnListen:
0x816291fc -> ($13)
0x80e840bc -> 0x80e83c40
0x80e83ec8 -> 0x80a694d0
0x816a1628 -> 0x80dd5840
0x80dd505c -> 0x80bd7700
0x80bd7798 -> 0x80f164b8
0x80f16768
tSshN-#
relates to SSH management. This will display as tSshN- and the number of connection. This number will mostly be less than 6 as by default most boxes are only allowed to have that many sessions.
Things to check:
Stack trace of tSshN-0:
0x816291fc -> ($13)
0x80d41d90 -> 0x80d47c90
0x80d4862c -> 0x80d4a6e0
0x80d4a724 -> 0x80d414f0
0x80d41594 -> 0x80d5d308
0x80d5d324 -> 0x80d84a48
0x80d84c08 -> 0x816a15d0
0x816a1628 -> 0x80dd5840
0x80dd505c -> 0x80bd7700
0x80bd7798 -> 0x80f164b8
0x80f16768
zOSPF6D
relates to, you guessed it, OSPF routing Protocol. This is another one though that you end up randomly seeing even when not in use.
Things to check:
- Routes
- Dynamic routing
- Tunnel VPNs
Stack trace of zOSPF6D:
0x81576154 -> ($13)
0x8130232c -> 0x811f4658
0x811f4914 -> 0x8136f638
0x8136f690 -> 0x815efb08
0x815efd08 -> 0x815ef910
0x815ef9b8 -> 0x815ecc90
0x80d3eeb0 -> ($2)
0x814e3c78 -> 0x814e80a0
0x814e80d0 -> 0x814e7cd4
0x814e7e1c -> 0x82060838
0x82060858 -> 0x80a8fa78
0x80a8ef38